Projects
Jane Street's October 2026 puzzle is a partially filled 11×11 grid of numbers and asks you to carve it into "states." Every state has to be connected and symmetric, some states have a capitol, and every cells number is the cheapest cost of travelling from that cell to the nearest capitol.
JavaScriptPythonOR-Tools CP-SAT
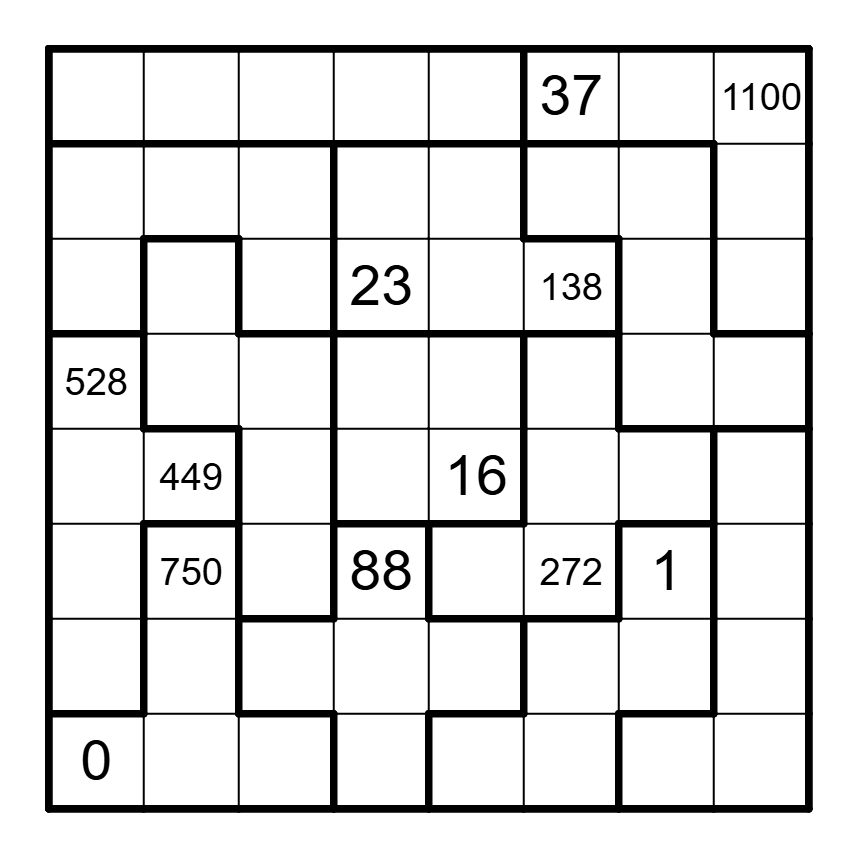
PythonJavaScript
PocketLens links your bank and brokerage accounts, shows what you're worth, and tracks where the money went. There's a SwiftUI iOS app and a React web app; both read the same Postgres database directly, and a Python service keeps that database in step with the banks.
SwiftReactSupabasePlaid
This is only really useful for people that live in NYC and have a lot of bilt points / Alaska points. It watches New York to Europe for two things at once: cash round trips under $325 all-in, and Alaska Mileage Plan award seats under 25,000 points (both limits discovered as good deals during EDA). The two legs don't have to match — a cash outbound with an award return counts, and all four combinations get searched.
It runs on a Raspberry Pi on a systemd timer and pushes a message to my phone when something clears the thresholds. No paid APIs, no headless browser, no scraping service.
I edit this to give different variations on the number of PTO days I want to take, overall cost limits, flexibility with more airports.
Python AutomationWeb Scraping
Kalshi lists markets on the daily high temperature at a single weather station. Austin's series is KXHIGHAUS: one event per day, and inside the event a row of contracts covering a strip of temperatures. -B65.5 pays out if the high lands in the 64.5–66.5 band. -T61 pays if the day never gets above 61, -T68 if it clears 68. Exactly one of them wins.
The bot builds its own forecast, converts it into a probability for each band, and buys the side where the market's price is far enough from that number to cover the fee.
PythonKalshi APIWebSocketsSciPy
Cut, trade, restructure, tag, tender, re-sign. Watch the cap move against you. Share the result so someone can tell you you're wrong.
Dead money and restructure mechanics are fiddly enough that a tool getting them wrong is worse than no tool, so that's where the work went. Player data comes from Spotrac and Blogging the Boys, and stays editable so it survives going stale.
Sports AnalyticsReact
I'd been playing Wordle since 2022 and kept making mistakes I knew a computer wouldn't make — guessing words that couldn't be the answer, wasting a turn on a letter I'd already ruled out. After 3Blue1Brown's video on solving it with information theory, I wanted to try it myself, but in a direction I'd actually learn something from. So the goal became two things at once: minimize guesses, and use it as a real introduction to reinforcement learning.
PythonC++Reinforcement Learning.
Calling a frontier model for every inference is slow and expensive, and for a narrow task like intent classification it's mostly wasted — the task doesn't need that much model. The usual answer is distillation: have the big model label data, train a small model on the labels. The part that gets skipped is that this is a pipeline, not a one-shot script. New examples keep arriving, labels go stale, and re-labeling from scratch every time defeats the point.
So I built the pipeline: a feature store that caches teacher outputs, keyed and freshness-tracked, so distillation can run continuously without paying for the same label twice.
GoKafkaRedisDistillation
Tackling is half of football and almost nothing about it shows up in a box score. A tackle depends on reading the play, shedding a block, closing the gap, and staying upright on the turf, and the stat sheet records exactly one bit of that: whether the tackle happened. For the 2024 NFL Big Data Bowl, Akil Daresalamwala, Rudra Raval and I tried to recover the rest of it from tracking data — modeling good tackling directly from where players actually were, frame by frame, rather than from the outcome alone.
A tackle is a two-stage process, so we built two metrics. SPEED (Strategic Pursuit Evaluation for Effective Defense) scores how well a defender closed on the ball carrier. WATT (Weighted Average Tackle Total) scores whether they finished once they got there. Plotting one against the other gives the VORTEX plot.
Sports AnalyticsPythonPandasSciPy